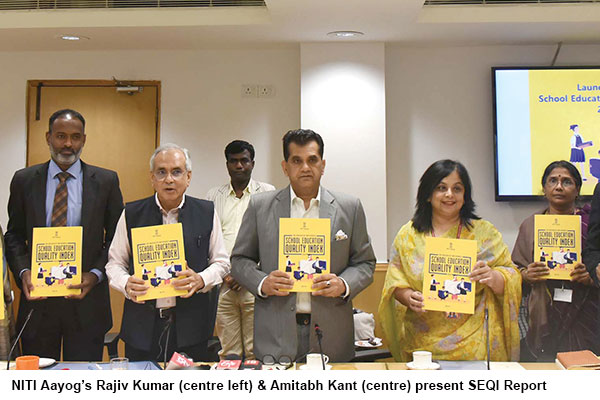
The release on September 30 of the School Education Quality Index (SEQI) by Niti Aayog — the Union government’s think tank — marks a new chapter in education development reportage and restoring competition between the states of the Indian Union after a gap of several years.
Among the several initiatives that were discontinued after the BJP-led NDA coalition swept to power at the Centre in 2014 was the annual Education Development Index (EDI), a statistical monitoring-cum-state rankings exercise initiated under the Education for All (EFA) global movement launched by Unesco in 2000.
In EDI introduced by the Union HRD ministry in 2008, states’ progress in K-12 education was assessed under the heads of access, infrastructure, teachers and outcomes. On the other hand, the outcomes-focused SEQI assesses education progress in the states under two broad categories. In the first category, learning, access, infrastructure and facilities and equity outcomes are assessed. In the second, governance processes which enable positive first category outcomes are measured.
The SEQI ranking of the 28 states and nine Union territories (UTs) on education development assesses the progress of the states under 30 indicators (parameters) with an aggregate weight of 956 with 2015-16 as the base year. The data used to compute SEQI has been mainly sourced from the Unified District Information System for Education (UDISE) published by the National University for Planning & Administration (NUEPA), Delhi and data derived from the National Achievement Survey field testing of class X students countrywide by NCERT. States have been divided into three blocks: large states (20), small states (8) and UTs (7).
Although Niti Aayog spokespersons tend to highlight differences between SEQI and EDI, the seaboard state of Kerala (pop.35 million), which routinely topped EDI, is also top-ranked in SEQI (2016-17) with Uttar Pradesh at the bottom in the block of 20 large states with scores of 76.6 and 36.4 percent respectively. The differential between the top and bottom-ranked small states is similar with Manipur’s performance score of 68.8 percent and 24.6 percent of Arunachal Pradesh. Among UTs, Chandigarh is top-ranked with 82.9 percent, with Lakshadweep at the bottom (31.9).
Apart from showing huge differences in scores between states, SEQI highlights why Chandigarh is the best overall performer in school education. It is awarded the highest score in most outcome indicators and governance processes aiding outcomes categories, with scores of 88.4 percent and 69.5 percent respectively. It is pertinent to mention that students from Chandigarh will represent India in the next Programme for International Student Assessment (PISA) exam, scheduled for 2021.
According to Amitabh Kant, CEO of Niti Aayog, measurement of outcomes is imperative for incentivising states and Union territories to improve the performance of their school systems. “SEQI has been developed to provide insights and data-based feedback on the success of school education across states and Union territories of India. The index attempts to provide a platform for promoting evidence-based policy making and highlighting possible course correction in the education sector,” says Kant in the foreword of SEQI 2016-17.
Although most educationists and experts who monitor the education scenario welcome SEQI inasmuch as it provokes competition between state governments to improve learning outcomes in K-12 education, there are some (constructively) discordant voices. “The SEQI report uses the word ‘outcomes’ liberally and mistakenly. In reality, SEQI is an ‘output’ rather than outcomes report,” says Arpit Chaturvedi, an alumnus of Cornell Institute for Public Affairs, USA and currently academic coordinator at the Indian School of Public Policy, New Delhi.
According to Chaturvedi, the availability of facilities is not reflective of outcomes. For instance, access to a library does not reflect how many books were subscribed by students or the number of hours spent by students in the library. “Moreover, there is no discussion on pedagogies and teachers’ attendance. Students’ test scores are assumed as proxies to ascertain whether real learning is happening,” he says.
The detail prescribed by Chaturvedi is perhaps too elaborate to be feasible. However with K-12 education standards in free fall countrywide, SEQI, designed to measure learning outcomes and institutional governance, cannot but be welcomed.
Autar Nehru (Delhi)
Also read: NITI Aayog School Education Quality Index report: Kerala, Rajasthan top performers


